- Operating loss is €10mln in H1 2010, down from a loss of €51mln H1 2009 – causes – lack of further deterioration on 2009 figures on the bank side and serious gains on the life insurance side.
- Ptsb is one of the largest mortgages lenders in the country, so their mortgages book should be – on average – performing above other banks. Here are some data: arrears > 90 days to the end of June 2010 in Irish residential mortgage book increased to 5.2% of the portfolio (H12009 figure was 3.9% so there was a significant jump). Non-performing mortgages are at 6.9% of the total loan book, up on 4.9% at the end of H2 2009. 32% of arrears cases are related to 100% mortgages – a predictable result as (a) 100% interest-only mortgages are of more recent vintage, hence written against younger families with higher probability of unemployment, and (b) these types of mortgages are more likely to involve purchases of buy-to-rent properties .
- As IL&P needs to raise ca €1.3-1.8bn more in bonds (good luck to them trying), higher cost of borrowing is going to further depress margins. So expect even more mortgage rates hikes from IL&P in months ahead. The bank has currently a €8 billion reliance on the ECB, unchanged. Hefty for a minnow.
Tuesday, August 31, 2010
Economics 31/8/10: IL&P reporting
The ‘healthiest of the sick’, IL&P reports its numbers today. Here are the headlines:
Monday, August 30, 2010
Economics 30/8/10: Euro area growth indicator slows in August
Eurozone's leading growth indicator, Eurocoin has fallen once again to 0.37 in August from July already anemic reading of 0.4. This means that my updated forecasts for Euro area growth remain in the range of 0% - 0.26%, with mid-range forecast of 0.20% for Q3 2010.
Chart below illustrates: In the mean time, continued pressures on Euro area economies and unbalanced nature of recovery (with Germany powering ahead, while the rest of Europe stagnates or continues to decline) are taking their toll on public confidence in European institutions.
Overall voters confidence in EU has dropped to record lows in most countries according to the Eurobarometer published on August 26th. Just 49% Europeans think that their country's membership of the EU is a "good thing" – lowest in 7 years. Trust in EU institutions has dropped to 42% from 48% recorded in Autumn 2009. Latest survey results are most likely impacted by the survey timing - carried out in May 2010 - at the peak of sovereign debt crisis worries. But it is unlikely that August events would have done much to repair this. PIIGS, plus Cyprus, Lux and Romania lead in terms of declines. Confidence in all PIIGS countries declined 10-18% yoy.
The latest Eurocoin leading indicator reading clearly suggests that unemployment and economic performance will remain leading causes of concerns across the EU (Eurobarometer recorded 48% of EU citizens being primarily concerned with rising unemployment, while economic crisis in general is a cause for concern for 40%). For the first time Eurobarometer also included Iceland, now a candidate for EU accession. Only 19% believe accession will be a good thing for their country and only 29 percent believe their country will benefit from EU membership.
Another interesting result was that when asked what they associate the EU with – most of the respondents said free travel and the euro, followed by peace and, amazingly, "waste of money" (23%). The latter category was led by Austrians (52%), Germans (45%) and Swedes (36%). Just 19% of respondents said the EU stands for democracy, a drop of seven points yoy. Just 10% of respondents in Finland, UK and Latvia identified "democracy" as a principle that is linked to the EU objectives. Romania (33%), Bulgaria (32%) and Cyprus (30%) were the countries with most positive view of the link between democracy and the EU. Overall, in no country did 'democracy' figure as the EU core objective for more than 1/3 of the population.
Support for EU acting as a policeman of financial markets was much stronger. 75% of the respondents said more coordination of economic and financial policies among member states would be effective in fighting economic crisis. 72% back a stronger supervision by the EU of international financial groups (though this majority increased just 4 points since 2009).
Perhaps encouraged by the public support for greater coordination, French and German authorities continue to move in the direction of enhanced harmonization of their tax systems. French budget minister Francois Baroin visited his German counterpart Wolfgang Schaeuble, making an announcement that "Germany is a model which should be a source of inspiration for [France]." Baroin also stated that France "intends to accelerate the harmonisation of both fiscal systems, on corporate as well as personal income taxes". President Sarkozy has requested the French court of auditors to issue a report (due for early findings release at the end of September) looking at areas of fiscal convergence with the German system. The report is due by the end of the year, but a pre-report will be published at the end of September. It is likely that France might move to abolish wealth tax as Germany did back in 1997. Per reports: "in the longer term, Paris is also looking at harmonising Vat, which is higher in France – 19.6% compared to the German 19%" and "capping the EU budget" to give national Governments more opportunities to slash domestic deficits. Mr Schaeuble indicated that Berlin wants consensus on European harmonisation on bank profits taxation - a subject for the next ministerial meeting between the French and German finance ministers in September.
Chart below illustrates:
 In the mean time, continued pressures on Euro area economies and unbalanced nature of recovery (with Germany powering ahead, while the rest of Europe stagnates or continues to decline) are taking their toll on public confidence in European institutions.
Overall voters confidence in EU has dropped to record lows in most countries according to the Eurobarometer published on August 26th. Just 49% Europeans think that their country's membership of the EU is a "good thing" – lowest in 7 years. Trust in EU institutions has dropped to 42% from 48% recorded in Autumn 2009. Latest survey results are most likely impacted by the survey timing - carried out in May 2010 - at the peak of sovereign debt crisis worries. But it is unlikely that August events would have done much to repair this. PIIGS, plus Cyprus, Lux and Romania lead in terms of declines. Confidence in all PIIGS countries declined 10-18% yoy.
The latest Eurocoin leading indicator reading clearly suggests that unemployment and economic performance will remain leading causes of concerns across the EU (Eurobarometer recorded 48% of EU citizens being primarily concerned with rising unemployment, while economic crisis in general is a cause for concern for 40%). For the first time Eurobarometer also included Iceland, now a candidate for EU accession. Only 19% believe accession will be a good thing for their country and only 29 percent believe their country will benefit from EU membership.
Another interesting result was that when asked what they associate the EU with – most of the respondents said free travel and the euro, followed by peace and, amazingly, "waste of money" (23%). The latter category was led by Austrians (52%), Germans (45%) and Swedes (36%). Just 19% of respondents said the EU stands for democracy, a drop of seven points yoy. Just 10% of respondents in Finland, UK and Latvia identified "democracy" as a principle that is linked to the EU objectives. Romania (33%), Bulgaria (32%) and Cyprus (30%) were the countries with most positive view of the link between democracy and the EU. Overall, in no country did 'democracy' figure as the EU core objective for more than 1/3 of the population.
Support for EU acting as a policeman of financial markets was much stronger. 75% of the respondents said more coordination of economic and financial policies among member states would be effective in fighting economic crisis. 72% back a stronger supervision by the EU of international financial groups (though this majority increased just 4 points since 2009).
Perhaps encouraged by the public support for greater coordination, French and German authorities continue to move in the direction of enhanced harmonization of their tax systems. French budget minister Francois Baroin visited his German counterpart Wolfgang Schaeuble, making an announcement that "Germany is a model which should be a source of inspiration for [France]." Baroin also stated that France "intends to accelerate the harmonisation of both fiscal systems, on corporate as well as personal income taxes". President Sarkozy has requested the French court of auditors to issue a report (due for early findings release at the end of September) looking at areas of fiscal convergence with the German system. The report is due by the end of the year, but a pre-report will be published at the end of September. It is likely that France might move to abolish wealth tax as Germany did back in 1997. Per reports: "in the longer term, Paris is also looking at harmonising Vat, which is higher in France – 19.6% compared to the German 19%" and "capping the EU budget" to give national Governments more opportunities to slash domestic deficits. Mr Schaeuble indicated that Berlin wants consensus on European harmonisation on bank profits taxation - a subject for the next ministerial meeting between the French and German finance ministers in September.
Friday, August 27, 2010
Economics 27/8/10: The path & cost of banks bailouts
On the foot of today's comment in the Financial Times, here are few quick estimates as to the extent to which current policy on banks recapitalization is bleeding the economy dry.
As estimated by myself (comfortably within the S&P projections), Ireland will stand to lose net:
My estimates translate into:
As estimated by myself (comfortably within the S&P projections), Ireland will stand to lose net:
- Nama - net loss of (mid-range) €12-19bn;
- Banks - net losses are €50-55.6bn.
My estimates translate into:
- Anglo Irish Bank expected supports are likely to exceed the overall decline in our GDP by a factor of more than 1.5 times (constant prices GDP fell €20.26bn between 2007-2009). Thus Anglo alone will cost Irish economy more than the entire Great Recession;
- The bailout will cost us €23,422-34,880 per each person in our labour force as of Q1 2010. Mid range estimate loss is €27,121. Note, labour force includes both employed and unemployed.
- The entire bailout of the banking system can end up costing Ireland in excess of x3 times the total economic loss incurred during this Great Recession.
- Anglo alone will cost us the equivalent of providing unemployment benefits for 2 years to over 1.25 million Irish workers.
- Anglo bailout would cover current Live Register costs for more than 6 years
- The banking bailout would have covered over one half of all outstanding mortgages in the nation once we adjust for interest accruals (a note to our FR: that's one hell of a real moral hazard, Mr Elderfield, much more real than any aid to mortgage holders you can ever fathom)
- The cost of bailout risks running at over €69,000 per family of 2 able-bodied adults either employed or unemployed
- 'Repairing' the banks Government-way can cost 35% of constant prices 2010 GDP or 43.2% of 2010 Gross Disposable National Income, using mid-range estimates for the expected bailout
Lastly, let me note that the alternatives to this 'blank cheque' recapitalization approach always existed and were known to the Government: see links here & here. Members of the cabinet were briefed as to the above-linked proposal and were provided with full cost estimates of these proposal. In at least one case, one cabinet member sought analysis/appraisal of the above proposal from official advisers, with evaluation returning 'no objections to the numbers cited' according to my source. In other words - they couldn't find anything wrong with it at least on the basis of quick evaluation.
Thursday, August 26, 2010
Economics 27/8/10: Manifesto I (?)
I will continue posting on this and will aggregate all ideas in my Long Term blog, with a banner link on my main page as well. All suggestions welcomed & will be published, some will make it to the list as well (as always - with proper attribution). So engage with me on this one!
Given the current market and economic conditions and the dire lack of credible economic policies (from any political party) aimed at moving Irish economy out of the combination of:
Is Ireland's electorate ready for an alternative political and popular movement that would put the interests of consumers and taxpayers at the top of governance and policy agenda?
Irish democracy cannot be surrendered to the vested interests, no matter how broadly-based, and elites (no matter how meritocratic or mobile they might be).
The current crisis has clearly shown that the corporatist state - where a group of vested interests colludes with the Government and state structures to set economic and social parameters for development priorities - is morally, politically and economically bankrupt.
The only two ways forward from this status quo are
It is therefore, clear to me that at this point in time Ireland is on the cusp of either opting for change or electing to undertake decade (if not decades) long descent into the nightmare of economic stagnation.
In my view, the agenda of such a movement should include the following reforms:
1) Banking reforms:
All suggestions welcomed & will be published, some will make it to the list as well (as always - with proper attribution). So engage with me on this one!
Given the current market and economic conditions and the dire lack of credible economic policies (from any political party) aimed at moving Irish economy out of the combination of:
- deeply rooted crisis in public finances;
- structural collapse of the banking sector;
- stratospherically high and increasingly long-term unemployment levels;
- lack of significant gains in competitiveness (not limited to the area of wages competitiveness, but including basic utilities costs, and costs of living and doing business relating to state-controlled sectors);
- malfunctioning markets for provision of domestic services - dominated and restricted by the excessive market power of the incumbent state-owned and state-regulated oligopolies;
- a clear predominance of policy measures that are designed to saddle ordinary families and individuals (consumers and taxpayers) with the full cost of stabilizing vested interests and elites (manifesting themselves in rising tax burden, falling provision of public services, lack of reforms in banking and public sectors); and
- continued devastation of private entrepreneurship and businesses, contracting investment and lack of confidence in the future of the economy and broader social progress
Is Ireland's electorate ready for an alternative political and popular movement that would put the interests of consumers and taxpayers at the top of governance and policy agenda?
Irish democracy cannot be surrendered to the vested interests, no matter how broadly-based, and elites (no matter how meritocratic or mobile they might be).
The current crisis has clearly shown that the corporatist state - where a group of vested interests colludes with the Government and state structures to set economic and social parameters for development priorities - is morally, politically and economically bankrupt.
The only two ways forward from this status quo are
- a generations-long and exceptionally deep crisis of stagnation and declining standards of living, or
- a path of structural reforms aimed at realigning the current political system to serve the interests of consumers and taxpayers - aka - the ordinary citizens and residents of this land.
It is therefore, clear to me that at this point in time Ireland is on the cusp of either opting for change or electing to undertake decade (if not decades) long descent into the nightmare of economic stagnation.
In my view, the agenda of such a movement should include the following reforms:
1) Banking reforms:
- Banks should be recapitalized following Swedish model (imposing haircuts/equity swaps on bond holders; accepting correct amounts of writedowns; equity taking by the State in the name of taxpayers; equity to be held in a Trust for individual taxpayers until disbursal; at disbursal - equity sales proceeds to be rebated, net of cost to the taxpayers)
- Nama to be reversed
- Anglo Irish Bank and INBS to be shut down and their liabilities and assets to be wound up within 5 years
- All banks boards and senior management teams replaced within 3 months
- All banks middle management teams reassessed and rebuilt within 12 months
- FDIC insurance scheme to be set up for the future needs of the sector
- No future bailouts constitutional amendment to be put to a referendum to prevent a possibility of any future calls on taxpayers wealth from any private sector firm
- Flat tax to be enacted on all incomes (preliminary estimates suggest 15-17% tax rate) with no discretionary deductions, but a generous upfront deduction of 1/2 of the median wage to be made available to all earners, plus 1/5 median wage deduction per child.
- Provision of strong (current level -10%), but life-time capped welfare provisions. Life-time cap will allow any able bodied adult in the country to have access to a cumulative maximum of 7 years of welfare provisions over their life time. Provision of welfare supports to those unable to work due to health or family circumstances (e.g caring for the disabled relative etc) to continue without life-time limits.
- Strong support for the disabled and the elderly must continue
- Wages for politicians and all senior servants earnings are to be tied to the National Disposable Income (NDI) on per capita basis (pcNDI): Taoiseach=3.5 times pcNDI; Ministers=3 times pcNDI; senior civil servants=max 2.7 times pcNDI; TDs/Senators=2.5 times pcNDI and so on. If the country earns more in disposable income, then those running it should get a reward, otherwise, they will automatically bear the same burden as the rest of economy. No bonuses to be allowed and all pensions to be converted to Defined Contribution plans.
- Benchmark Government spending to 35% of GDP, with emergency spending not to exceed 37% of GDP in any given year, and a balanced budget over every 3 year period. This allows for small emergency spending boosts in recessions, but prevents spending sprees in elections etc
- All quangoes, except those with immediate independent oversight authority (e.g FR and Competition Authority) are to be abolished and their functions transferred to respective departments. Responsibility for governance and management must rest with the executive branch of the state - i.e. Government.
- There should be no taxation without representation - self-employed individuals who are fully tax compliant should have access to same unemployment benefits as anyone else.
- Tax system should be fully reformed to simplify existent taxation and ensure full compliance. This will include, in addition to the flat income tax - abolition of all indirect charges and taxes, other than direct user fees which will be fully ring-fenced to provide revenue necessary to maintain specific service (e.g. bin charges, water rates etc). VRT will be abolished. Any excise taxes will be set at a level required solely to support provision of services directly associated with the underlying consumption charged. For example, petrol levy will apply only to the amount required to support environmental programme related to CO2 abatement and improvement of the environment. It will not be allocated into the general budget. There will be a fully transparent tax on land values (LVT), but not a property tax. The revenue from LVT will be split 50:50 between central & local authorities and local authorities will be allowed a discretion to vary their rate of LVT within reasonable parameters. For example, if LVT is levied at 1% pa, then local authority can be allowed to charge between 0.25% and 0.5% as it deems suitable, while the central government will collect 0.5%. CGT and CAT will be abolished for all investments held for 5 years or longer to encourage longer term savings and investment.
- Core change to the Government model will be transparency and accountability based on automatic systems of disclosure and control that are not subject to tampering by individual ministers/politicians or civil servants
- Transparency: all state data/decisions/discussions not subject to secrecy of the state considerations will be published on the web and made accessible free of charge to all residents of the state. Commercially sensitive data will be published with exclusion of sensitive information and identifiers, until the time when it can be published in full. All data requested under FOI will be released free of charge to the requestee and will be automatically published also on the public web portal to remove any need for future FOI requests
- Accountability: performance and productivity metrics will be designed for all branches of public sector and wages and earnings in the public sector will be tied into these.
- Any attempts by public employees or office holders to undermine the principles of transparency and accountability in dealing with the public will be punished on the basis of publicly available procedures. All disciplinary actions against aforementioned employees or office holders will be made publicly available.
- Local authorities will be reformed, reducing the overall number of local authorities to 7, covering: West & North West, South, Greater Cork, Greater Dublin, Greater Limerick, Greater Galway and Border & Midlands.
- Seanad will be reformed (subject to referendum) to give it real powers of the upper chamber comparable to the US Senate. It will be elected directly by the people of Ireland, with equal representation of 5 senators from each of the 7 geographic region outlined above.
- Dail will be reformed - there will be no expenses, no additional pay for work in special committees (every TD will be required, subject to seniority to carry such work as a part of their duties). The number of TDs will be reduced to roughly 2/3rd of the current. TDs will be entitled to a defined contribution pension top up to their existent private pensions with the state matching 1:1 every euro they put into their pension.
- Members of the cabinet will have no drivers, state cars and there will be no Government jet. Members of the cabinet will qualify for a car allowance equivalent to €10,000 per annum. All members of the Oireachtas and Government traveling on official business will be reimbursed only to the full cost of the ticket for economy flight on any flight under 5 hours of length and business class for flights of longer duration. No employee of the State will be entitled to any travel reimbursement in excess of an economy class ticket.
- No member of the Oireachtas or employee of the state will be exempt from any of the standard tax codes or laws of this land. There can be no privilege for the servants of the public that the public itself cannot claim.
- All state purchasing will be carried on-line, made public and transparent.
- State will purchase services, such as health care, care for the elderly, disabled etc for those who cannot afford them, but the State will not own service providers. Instead, public companies will be mutualized or privatized and forced to compete directly for the custom of the people. Transition to such an arrangement will require significant reforms, but also support for current employees in training them in running a private/mutual/non-profit etc enterprises. This support will be provided.
- Higher education will be fees-based, with fees set by universities and overseen by the Department for Education. The State will set up (with participation of charities and other private agencies) a number of funds that will administer financial aid to students based on need (with an objective of creating an equal opportunity for all qualified students to undertake studies) as well as merit (with an objective of rewarding real achievement).
All suggestions welcomed & will be published, some will make it to the list as well (as always - with proper attribution). So engage with me on this one!
Wednesday, August 25, 2010
Economics 25/8/10: Derivatives time bomb?
An interesting number popped out today from the dark depths of the past (hat tip to Ed).
With my emphasis, quoting from the article published in December 2008 by the Chartered Accountants Ireland (linked here) titled "Financial Derivitives (sic), Villian (sic) or Scapegoat" written by Grellan O'Kelly (who worked at the time in the Policy Section of the Financial Institutions and Funds Authorisation Department of the Financial Regulator):
"...when looking at the outstanding derivative positions (notional values) of our main banks as reported in their annual reports, the amounts are extremely small when compared to the total global amounts. A recent BIS survey2 on global OTC positions shows that global notional amounts come to a staggering $516 trillion. The most recent disclosures from our two main retail banks show that their gross notional exposures amount to €640 billion, only 0.17% of the total. ...noting that access to accurate data on derivative products is not always publicly available."
The article contains the usual caveat that "Any views expressed in this article are made in a personal capacity and are not intended to represent the views of the Financial Regulator." Nonetheless, it would be good to get some comment from the FR on this. After all, €640bn might be a small level of exposure to derivatives from the point of view of global banks, but for BofI and AIB to have such an exposure... is roughly 170% of the total 2009 asset base of all Irish banks combined.
For now, I cannot confirm whether this was a typo or not.
The problem is that unwinding even the straight forward swaps can be extremely costly. Buffet's unwinding of lost contracts against reinsurance claims cost Berkshire some $400mln back in 2008. In the case of interest rates swaps written against property, De Montfort University research in June 2010 has estimated that for a book of £143bn of interest rate swaps in the UK (57% of the total existing UK £250bn book of loans is estimated to be hedged by derivatives - here), the cost of unwinding these positions runs into ca £10bn.
So applying the UK estimate to our potential exposure, the cost of unwinding those €640bn in derivatives can be to the tune of €45bn.
Of course, this is just an estimate, but it gives some perspective to the numbers.
But let's ad some relative comparatives (hat tip to Conor for both):
I am totally at a loss as to this figure - given its size - so any comment on its validity will be appreciated.
With my emphasis, quoting from the article published in December 2008 by the Chartered Accountants Ireland (linked here) titled "Financial Derivitives (sic), Villian (sic) or Scapegoat" written by Grellan O'Kelly (who worked at the time in the Policy Section of the Financial Institutions and Funds Authorisation Department of the Financial Regulator):
"...when looking at the outstanding derivative positions (notional values) of our main banks as reported in their annual reports, the amounts are extremely small when compared to the total global amounts. A recent BIS survey2 on global OTC positions shows that global notional amounts come to a staggering $516 trillion. The most recent disclosures from our two main retail banks show that their gross notional exposures amount to €640 billion, only 0.17% of the total. ...noting that access to accurate data on derivative products is not always publicly available."
The article contains the usual caveat that "Any views expressed in this article are made in a personal capacity and are not intended to represent the views of the Financial Regulator." Nonetheless, it would be good to get some comment from the FR on this. After all, €640bn might be a small level of exposure to derivatives from the point of view of global banks, but for BofI and AIB to have such an exposure... is roughly 170% of the total 2009 asset base of all Irish banks combined.
For now, I cannot confirm whether this was a typo or not.
The problem is that unwinding even the straight forward swaps can be extremely costly. Buffet's unwinding of lost contracts against reinsurance claims cost Berkshire some $400mln back in 2008. In the case of interest rates swaps written against property, De Montfort University research in June 2010 has estimated that for a book of £143bn of interest rate swaps in the UK (57% of the total existing UK £250bn book of loans is estimated to be hedged by derivatives - here), the cost of unwinding these positions runs into ca £10bn.
So applying the UK estimate to our potential exposure, the cost of unwinding those €640bn in derivatives can be to the tune of €45bn.
Of course, this is just an estimate, but it gives some perspective to the numbers.
But let's ad some relative comparatives (hat tip to Conor for both):
- Ireland accounted for 0.17% of global estimates of OTC derivatives but only 0.03% of Global GDP (based on CIA fact book and CSO data)
- €640bn is 4.12 times our 2008 Gross Value Added (ca €155bn)
I am totally at a loss as to this figure - given its size - so any comment on its validity will be appreciated.
Economics 25/8/10: S&P & the horrific cost of banks bailouts
As you all know, Standard & Poor (S&P) downgraded Irish sovereign debt to AA- from AA with a negative outlook. The downgrade was mainly motivated by the fact that the cost of the Irish banking bailout has increased significantly over previous expectations. S&P now estimate the cost of recapitalising the Irish financial system at €45-50bn, up from €30-35bn.
In my view, this is still behind the news curve in terms of estimated total costs.
My projections for total losses are as follows:
Importantly, S&P's negative outlook allows for the possibility that the rating could be cut
further if the Government fails to deliver on promised fiscal stabilization. This can occur either due to significant continued deterioration in underlying economic conditions or due to the failure of the Government to actually implement planned cuts, or both.
S&P's current position rates Ireland at the same level as Fitch and one notch below Moody’s, but both of these are keeping Ireland on a stable outlook.
S&P latest estimate is for Ireland net government debt / gross GDP ratio reaching 113% in 2012. Forever cheerful folks at DofF projected this ratio to be 83.9% in 2012 in their Budget 2010 figures. This shows just how much can change in 8 months time. S&P's estimate for debt implies Ireland is facing greater debt mountain than similar rated Belgium and Spain.
But here comes a tricky part. Remember that our debt is currently yielding in excess of 5.5% for 10 year notes. This implies that in 2012, we can expect to pay out 6.215% of our GDP in interest payments alone, or 7.52% of our domestic economy total income. The bill will be €10,241 million - using DofF forecasts - or 20.5% of the total current expenditure planned by the Government. All in, even by rosy projections from DofF for tax revenue, our interest bill alone will be swallowing every third euro revenue will bring in.
This puts into perspective recent ECB research that concluded that debt levels above 90-100% of GDP are, "on average, harmful for growth" and that porblems could arise at the debt levels of as low as 70% of GDP. ECB currently projects that euroarea-wide average debt levels will reach 88.5% in 2011. Does anyone believe anymore that Ireland can run 2.5-3% annual growth rate in the current conditions as projected by the IMF? Or 4.5-4.3% (2012-2013) real GDP growth as projected by DofF?
In my view, this is still behind the news curve in terms of estimated total costs.
My projections for total losses are as follows:
- Nama - net loss of (mid-range) €12bn, rising to €19bn in the worst case scenario (although I have not redone estimates for this scenario for some time and they reflect 55% haircut applied on Tranche 1);
- Anglo - €33bn in mid-range case, rising to €38.6bn in the worst case scenario (another update is due once the bank reports its results in the next few weeks);
- INBS - €6bn, no range as we have little clarity as to their balance sheets details;
- AIB - €7bn mid-range, assuming successful disposal of M&T and BZBWK, worst case scenario €9bn;
- BofI - €2bn.
Importantly, S&P's negative outlook allows for the possibility that the rating could be cut
further if the Government fails to deliver on promised fiscal stabilization. This can occur either due to significant continued deterioration in underlying economic conditions or due to the failure of the Government to actually implement planned cuts, or both.
S&P's current position rates Ireland at the same level as Fitch and one notch below Moody’s, but both of these are keeping Ireland on a stable outlook.
S&P latest estimate is for Ireland net government debt / gross GDP ratio reaching 113% in 2012. Forever cheerful folks at DofF projected this ratio to be 83.9% in 2012 in their Budget 2010 figures. This shows just how much can change in 8 months time. S&P's estimate for debt implies Ireland is facing greater debt mountain than similar rated Belgium and Spain.
But here comes a tricky part. Remember that our debt is currently yielding in excess of 5.5% for 10 year notes. This implies that in 2012, we can expect to pay out 6.215% of our GDP in interest payments alone, or 7.52% of our domestic economy total income. The bill will be €10,241 million - using DofF forecasts - or 20.5% of the total current expenditure planned by the Government. All in, even by rosy projections from DofF for tax revenue, our interest bill alone will be swallowing every third euro revenue will bring in.
This puts into perspective recent ECB research that concluded that debt levels above 90-100% of GDP are, "on average, harmful for growth" and that porblems could arise at the debt levels of as low as 70% of GDP. ECB currently projects that euroarea-wide average debt levels will reach 88.5% in 2011. Does anyone believe anymore that Ireland can run 2.5-3% annual growth rate in the current conditions as projected by the IMF? Or 4.5-4.3% (2012-2013) real GDP growth as projected by DofF?
Monday, August 23, 2010
Economics 24/8/10: Anglo Tranche 2 goes 'Boom!'
Two weeks ago in a post on Anglo (here) I provided a quick explanation of my forecasts for why the mid range expected capital hit on the entire Anglo book of ca €72bn worth of loans (original face value) will be in the region of €33bn. This estimate referred to the mid-range assumptions.
In the light of today's speculations/reports (here) that the final Tranche 2 haircut on Anglo loans will be 61.93% I am now more confident in my original lower- and mid-range estimates, though adjusting my upper margin loss estimate down a notch.
To repeat my projections are:
As telling as the haircuts are the assumed LTEVs - in Tranche 1 the implied LTEV was 11 percent. In Tranche 2 this is down to 9 percent. Since Nama marks to November 2009, this change can be explained either by lower quality of loans being taken on board (bad news for Nama, better news for banks) or by Nama aggressive drive into raising cash flow (good news for Nama, bad news for the banks).
Now, to my valuations. Table below summarizes:
 Notice, I allow for interest margins of 1.5% pa in my mid-range assumptions. This is rather unlikely. To end of 2009, interest margin on Anglo loans (performing) was roughly 1% and this did not reflect Nama costs. In addition, my mid-range scenario assumes Nama recovering 100% of the principal amount of the loans - something that I believe to be equally unlikely. Either way, mid-range estimate implies that Messr Aynsley and Dukes will be coming in with new demands for cash soon - to the tune of €8.5bn more based on my mid-range scenario.
In the light of today's speculations/reports (here) that the final Tranche 2 haircut on Anglo loans will be 61.93% I am now more confident in my original lower- and mid-range estimates, though adjusting my upper margin loss estimate down a notch.
To repeat my projections are:
- Worst case scenario for Anglo requires €38.6bn (down from €38.9bn)
- The mid-range is €33bn in total hit (same as earlier)
- The best case scenario is €30bn (same as earlier)
As telling as the haircuts are the assumed LTEVs - in Tranche 1 the implied LTEV was 11 percent. In Tranche 2 this is down to 9 percent. Since Nama marks to November 2009, this change can be explained either by lower quality of loans being taken on board (bad news for Nama, better news for banks) or by Nama aggressive drive into raising cash flow (good news for Nama, bad news for the banks).
Now, to my valuations. Table below summarizes:
 Notice, I allow for interest margins of 1.5% pa in my mid-range assumptions. This is rather unlikely. To end of 2009, interest margin on Anglo loans (performing) was roughly 1% and this did not reflect Nama costs. In addition, my mid-range scenario assumes Nama recovering 100% of the principal amount of the loans - something that I believe to be equally unlikely. Either way, mid-range estimate implies that Messr Aynsley and Dukes will be coming in with new demands for cash soon - to the tune of €8.5bn more based on my mid-range scenario.
Economics 23/8/10: ECB & IRL bonds
Per report today: "FRANKFURT, Aug 23 (Reuters) - The ECB said on Monday it bought and settled €338mln worth of bonds last week, the highest amount since early July and bolstering recent market talk it had ramped up purchases of Irish bonds. The amount is well above €10mln of purchases settled the previous week... It follows recent comments by market participants that the ECB bought 60 million euros of 2012 Irish government bonds just over a week ago, after spreads over German Bunds ballooned. The ECB has not given any details of its bond buying."
I speculated after last auction results were announced by the NTMA that extraordinary level of cover (x5.4) on 4 year bonds issue looked strange and that ECB buying might be the case. To remind you - NTMA sold €500mln of 4-year bonds. It now appears that the ECB did indeed engage in potentially substantial buying of Irish bonds. If so, such buying cold have
All in, we are clearly now in the yields zone where the markets are happy to watch us lean on ECB, the ECB is happy to watch us skip one-legged across budgetary deficit that keeps opening up wider and wider. Clearly, such an equilibrium is unlikely to be stable. Expect some fireworks once markets come back to full swing a week from now.
I speculated after last auction results were announced by the NTMA that extraordinary level of cover (x5.4) on 4 year bonds issue looked strange and that ECB buying might be the case. To remind you - NTMA sold €500mln of 4-year bonds. It now appears that the ECB did indeed engage in potentially substantial buying of Irish bonds. If so, such buying cold have
- pushed other purchasers out of the shorter term paper into 10 year bonds; and/or
- pushed yields on both shorter and longer term paper down.
All in, we are clearly now in the yields zone where the markets are happy to watch us lean on ECB, the ECB is happy to watch us skip one-legged across budgetary deficit that keeps opening up wider and wider. Clearly, such an equilibrium is unlikely to be stable. Expect some fireworks once markets come back to full swing a week from now.
Economics 23/8/10: Is ECB contradiciting itself on banks stability?
Updated below
Here is a note of the day, to be followed by a question of the day:
ECB's Axel Weber (a 'hawk' in his pre-crisis life) is proposing in the FT today that the ECB should extended unlimited refinancing operations for Eurozone banks up to three months until at least early 2011.
This call, if followed upon, would
So either the tests were useless (in which case Weber is right in his call) or ECB has no business continuing priming the liquidity pump (in which case Weber is wrong in his call).
And a couple of hours after my question of the day note above, Bloomberg weighed in with a mighty crack at the ECB's position (here).
Here is a note of the day, to be followed by a question of the day:
ECB's Axel Weber (a 'hawk' in his pre-crisis life) is proposing in the FT today that the ECB should extended unlimited refinancing operations for Eurozone banks up to three months until at least early 2011.
This call, if followed upon, would
- make it harder for the ECB to execute any serious QE exit strategy,
- shows that the situation in the EU banking sector remains critical;
- indicates that forward looking central bankers, like Weber don't really believe that the funding markets are ready to properly price the risks of European (including, of course, German) banks, even in the short run (under 1 year);
- shows clearly that despite statements to the contrary, ECB governors (at least some) don;t really buy into the idea that Euro area banks will be able to unwind, absent ECB help, the €1.3 trillion in debt coming due in the next 2 years.
So either the tests were useless (in which case Weber is right in his call) or ECB has no business continuing priming the liquidity pump (in which case Weber is wrong in his call).
And a couple of hours after my question of the day note above, Bloomberg weighed in with a mighty crack at the ECB's position (here).
Sunday, August 22, 2010
Economics 22/8/10: Fundamentals of investing in IRL Inc - IV
This is the last post in the series of four that presents fundamentals comparatives between Ireland, Switzerland and Luxembourg. The first post (here) covered analysis of current account dynamics, the second post (here) dealt with General Government balance, third post (here) highlighted differences in GDP and income. This post deal with residual fundamentals such as inflation, unemployment and population.
In terms of inflation we are not doing too well. Since 2000 Ireland remains expensive. More expensive than Switzerland, despite our massive bout of deflation. This, of course, does not account for the fact that Swiss residents get much better quality public sector services than we do, for less money spent. But that's a matter of a different comparison that I touched upon earlier (here, here and here).
So Chart 12 shows our inflation performance.
Chart 12:

You wouldn't be picking Ireland for your investment if you were concerned with real returns or with effects of inflation on economy's ability to carry debt.
If population growth is really a longer term dividend, we should expect Ireland Inc to overtake Switzerland by now in terms of prosperity (Chart 13). After all, our 1980s and 1970s'-born cohorts are currently at the peak of their productivity. But recall per capita GDP... so far, there isn't really any evidence that growth in population leads to higher growth in GDP once scale effects are taken out of equation.
Chart 13:

Would you have invested in Ireland's debt if you were thinking about Ireland's ability to repay on the basis of lower costs of unemployment and greater proportion of labour force at work? Take a look at Chart 14.
Chart 14:
Well, not really. Swiss and Lux make for a much more compelling case here and not just in the current crisis environment.
So here's our real problem that is not a function of cyclical dynamics, but a structural one. Our employed are carrying much greater burden of providing for the rest of our population than Switzerland (Chart 15).
Chart 15:

Factor in that Irish public sector is larger, in relative-to-population terms than Swiss... and you have an even greater discrepancy in terms of the true earning capacity of the Irish economy.
Chart 16:

May be, just may be it was because our wealthy developers all wanted a fine Swiss watch, while no Swiss investors wanted our bungalows in Drogheda or apartments in Tallaght? which is the same as to say - the Swiss are productive to the point of the rest of the world wanting their goods and services. We are productive only to the extent of the rest of the world wanting goods and services produced by MNCs and few indigenous exporters based here. But their productivity is high in gross terms and low in net terms (recall current account analysis in the first post). Unless we can dramatically increase the number of exporters while simultaneously upping the net value added in their operations to Swiss levels, there's no chance external trade can carry this economy out of the recession.
In terms of inflation we are not doing too well. Since 2000 Ireland remains expensive. More expensive than Switzerland, despite our massive bout of deflation. This, of course, does not account for the fact that Swiss residents get much better quality public sector services than we do, for less money spent. But that's a matter of a different comparison that I touched upon earlier (here, here and here).
So Chart 12 shows our inflation performance.
Chart 12:

You wouldn't be picking Ireland for your investment if you were concerned with real returns or with effects of inflation on economy's ability to carry debt.
If population growth is really a longer term dividend, we should expect Ireland Inc to overtake Switzerland by now in terms of prosperity (Chart 13). After all, our 1980s and 1970s'-born cohorts are currently at the peak of their productivity. But recall per capita GDP... so far, there isn't really any evidence that growth in population leads to higher growth in GDP once scale effects are taken out of equation.
Chart 13:

Would you have invested in Ireland's debt if you were thinking about Ireland's ability to repay on the basis of lower costs of unemployment and greater proportion of labour force at work? Take a look at Chart 14.
Chart 14:

Well, not really. Swiss and Lux make for a much more compelling case here and not just in the current crisis environment.
So here's our real problem that is not a function of cyclical dynamics, but a structural one. Our employed are carrying much greater burden of providing for the rest of our population than Switzerland (Chart 15).
Chart 15:

Factor in that Irish public sector is larger, in relative-to-population terms than Swiss... and you have an even greater discrepancy in terms of the true earning capacity of the Irish economy.
Chart 16:

May be, just may be it was because our wealthy developers all wanted a fine Swiss watch, while no Swiss investors wanted our bungalows in Drogheda or apartments in Tallaght? which is the same as to say - the Swiss are productive to the point of the rest of the world wanting their goods and services. We are productive only to the extent of the rest of the world wanting goods and services produced by MNCs and few indigenous exporters based here. But their productivity is high in gross terms and low in net terms (recall current account analysis in the first post). Unless we can dramatically increase the number of exporters while simultaneously upping the net value added in their operations to Swiss levels, there's no chance external trade can carry this economy out of the recession.
Economics 22/8/10: Fundamentals of investing in IRL Inc - III
This is the third post in the series of four that presents fundamentals comparatives between Ireland, Switzerland and Luxembourg. The first post (here) covered analysis of current account dynamics, the second post (here) dealt with General Government balance. This post will highlight differences in GDP.
Once again, think of an investor making a choice between sovereign debt of three countries. Fundamentals about current account (external surpluses generated by economy - subject of the first post), government balances (second post), economic income and growth (present post), as well as unemployment, population and income per working person (following concluding post) all help underpin the economy ability to repay its sovereign debts.
So far, we have shown that:
Let me put a caveat here - analysis of GDP figures for Lux is a bit tricky, since Luxembourg official stats exclude all those people who work in Luxembourg but reside outside its borders. So the best benchmark here is Switzerland. Sotake a look at the 'Celtic Tiger' vis-a-vis Switzerland. 2002-2007 growth rates are virtually identical in both. But since 2007 - we have been a basket case, while Swiss have been ticking along nicely, like a fabled clock.
Chart 8:

And this is highlighted in each country share of the world GDP as well: we have 61% of Swiss population and 886% of Lux's population (Chart 9). Yet we have - in absolute terms - 54% of Swiss global share of GDP and 438% of Lux's. PPP-adjusted, our GDP is just 28.8% of Swiss and 400% of Lux's. In current prices-measured GDP, Ireland's GDP is 42.2% of Swiss and 400% of Lux's. So that population growth dividend isn't really working for us so far.
Chart 9:

Per capita GDP in current prices (Chart 10):
Chart 10:

Of course, we were a stellar performer in terms of GDP growth prior to 2006. That's one fundamental where we did shine. But stripping out construction sector contribution in 2001-2007, we are not that spectacular (Chart 11)...
Chart 11:
 The fourth and last post will conclude by making comparisons across other variables, such as inflation, population growth and labour markets.
Once again, think of an investor making a choice between sovereign debt of three countries. Fundamentals about current account (external surpluses generated by economy - subject of the first post), government balances (second post), economic income and growth (present post), as well as unemployment, population and income per working person (following concluding post) all help underpin the economy ability to repay its sovereign debts.
So far, we have shown that:
- By external balances metric, Ireland is a much poorer performer than either Switzerland or Lux;
- By sovereign balances metric, Ireland is a much poorer performer than either Switzerland or Lux
Let me put a caveat here - analysis of GDP figures for Lux is a bit tricky, since Luxembourg official stats exclude all those people who work in Luxembourg but reside outside its borders. So the best benchmark here is Switzerland. Sotake a look at the 'Celtic Tiger' vis-a-vis Switzerland. 2002-2007 growth rates are virtually identical in both. But since 2007 - we have been a basket case, while Swiss have been ticking along nicely, like a fabled clock.
Chart 8:

And this is highlighted in each country share of the world GDP as well: we have 61% of Swiss population and 886% of Lux's population (Chart 9). Yet we have - in absolute terms - 54% of Swiss global share of GDP and 438% of Lux's. PPP-adjusted, our GDP is just 28.8% of Swiss and 400% of Lux's. In current prices-measured GDP, Ireland's GDP is 42.2% of Swiss and 400% of Lux's. So that population growth dividend isn't really working for us so far.
Chart 9:

Per capita GDP in current prices (Chart 10):
Chart 10:

- 2008 peaks in all three countries: Luxembourg=USD118,570.05, Ireland= USD60,510.00, Switzerland= USD68,433.12
- Peaks recovered by: Luxembourg= USD119,048.05 by the end of 2015, Ireland= USD60,729.66 by the end of 2019, Switzerland= USD69,838.79 by the end of 2010.
Of course, we were a stellar performer in terms of GDP growth prior to 2006. That's one fundamental where we did shine. But stripping out construction sector contribution in 2001-2007, we are not that spectacular (Chart 11)...
Chart 11:
 The fourth and last post will conclude by making comparisons across other variables, such as inflation, population growth and labour markets.
Economics 22/8/10: Fundamentals of investing in IRL Inc - II
This is the second post in the series of four that presents fundamentals comparatives between Ireland, Switzerland and Luxembourg. Post I (here) covered analysis of current account dynamics. The present post will deal with General Government balance.
Now, let's check IRL's sovereign solvency position. Chart 5 illustrates:
Chart 5:

Again, if you are an investor hoping to get repaid on your bonds, you wouldn’t really go for Ireland as a place to park your money. Except during 1996-2001 and 2003-2007. But then, get out as fast as you can in 2007. All in, Ireland Inc hasn't paid its bills since 2007.
Let's see if the Government has been running operations consistent with long term attractiveness to sovereign investors. To do so, suppose we invested in the bonds written against General Government balances. Since timing matters, let us take two scenarios: investing €1.00 in 1980 and investing €1.00 in 1995, holding to 2010 or 2011.
So cumulative returns on countries sovereign balances from 1980 are (Chart 6):
Chart 6:

Chart 7 showsSlide 7

So a portfolio of 50:50 split between 1980 investment and 1995 investment written against Irish Governments' fiscal positions since 1980 would have lost to investor 12.95% by 2010 and 2011, compared to a similar allocation into other two countries.
Now, let's check IRL's sovereign solvency position. Chart 5 illustrates:
Chart 5:

Again, if you are an investor hoping to get repaid on your bonds, you wouldn’t really go for Ireland as a place to park your money. Except during 1996-2001 and 2003-2007. But then, get out as fast as you can in 2007. All in, Ireland Inc hasn't paid its bills since 2007.
Let's see if the Government has been running operations consistent with long term attractiveness to sovereign investors. To do so, suppose we invested in the bonds written against General Government balances. Since timing matters, let us take two scenarios: investing €1.00 in 1980 and investing €1.00 in 1995, holding to 2010 or 2011.
So cumulative returns on countries sovereign balances from 1980 are (Chart 6):
- 2010: Ireland=28.5%, Switzerland=32.2%, Lux=43.3%. Ireland gap to best performer = -14.8%
- 2011: Ireland=25.4%, Switzerland=31.9%, Lux=41.1%. Ireland gap to best performer = -15.7%
- 2010-2011 gap deterioration for Ireland = -0.9%
Chart 6:

Chart 7 shows
- 2010: Ireland=-12.2%, Switzerland=-1.1%, Lux=-3.85%. Ireland gap to best performer=-11.1%
- 2011: Ireland=-11.1%, Switzerland=-0.9%, Lux=-5.1%. Ireland gap to best performer=-10.2%
- 2010-2011 gap improvement for Ireland = +0.9%

So a portfolio of 50:50 split between 1980 investment and 1995 investment written against Irish Governments' fiscal positions since 1980 would have lost to investor 12.95% by 2010 and 2011, compared to a similar allocation into other two countries.
Economics 22/8/10: Fundamentals of investing in IRL Inc - I
Few months ago, while speaking as a guest on RTE's Frontline, I confronted two of our 'surrender to Brussels' politicians with a suggestion that a country can do just fine outside the 'Yes, Commissioner' world of European convergence consensus. In return, one politician - from the opposition side of the Dail - rushed to conclude that when advocating greater sovereignty on economic policies I was talking about the UK. My reply was that I had in mind more the path of the country like Switzerland.
In the light of the ongoing sovereign crisis, and with all the talk about bond markets unwillingness to underwrite our economy, I decided to return to the same issue. Here are major comparatives in investment (bonds-related) fundamentals in Ireland vis-a-vis Switzerland and Luxembourg.
I do this in a series of 4 posts. The first one deals with current account dynamics, the second one will deal with Government finances, the third one will show comparatives for GDP, and the fourth one will conclude by making comparisons across other variables, such as inflation, population growth and labour markets.
All data is based on IMF's World Economic Outlook, updates for April and July 2010, which covers period from 1980-2015. Some additional forecasts (beyond 2015) were performed by myself, alongside some additional variables computations.
I chose the two countries for several reasons:
Chart 1:
 If our expected current account surplus of 2010 were to be used to pay down our debt, how long would it take? The answer to it is 'forever'. Our net surplus from trade and investments from the entire world was negative €4.03bn throughout the 2000s. In the 1990s, our average current account surplus was just €1.108bn, in 2010 our expected surplus in the only year when current account was positive in the 200s - the year 2010 - will be only €849mln. At the same time, our debt currently stands at €86.83bn and rising with interest bill on this well in excess of €4.56bn annually at latest 10 year bond auction yields. In other words, exporting our way out of the recession will not even cover our entire interest bill.
Here's an interesting observation. Irish Government thinks that exports will carry Ireland out of the recession. However, there is an argument to be made that value added in our exports is not really that impressive once the inputs costs are taken out.
Chart 2: If you were an investor thinking about Ireland's fundamentals, you wouldn't have much hope of getting a positive return on your investment, if net exports were your underlying security, except in the period 1992-2000.
This, one can argue, might be true of our manufacturing exports, where we import often expensive inputs and where transfer pricing (on inter-company sales) further contributes to lower net value added. But what about our services trade? Well, the current account data shows that during the last decade, when services trade really started to take off in Ireland, our net external balance was negative. So something is not adding up and I will take a look at this in the forthcoming posts.
But for now, we do have impressive exporters, yet our current account performance has been exceptionally weak, compared to Switzerland and Luxembourg - two countries that are equally as reliant on imported inputs as Ireland.
It is worth noting also that in the case of Switzerland, their exports composition includes significant pharma and high tech manufacturing exports as well. It just appears that they manage to do trade better...
In fact, a bet made on Ireland Inc based on its external economic performance back in 1980 would have been a disastrous one as Chart 3 below illustrates. An investor betting on our external balance would have 48.1 cents on every euro invested. Based on IMF forecasts, by 2015 this loss can be expected to widen to 48.9 cents. At the same time, identical bet on Luxembourg would have netted a gross return of over €5.11 by now, and a projected gain of €9.20 by 2015: a spread in return relative to Ireland of €5.59 by 2010 and €9.69 by 2015.
Chart 3:
 The differences are even more dramatic when we look at comparison to Switzerland: a bet of €1.00 on Swiss external balance made in 1980 would have netted investor €8.145 by 2010 and is expected to yield €13.434 by 2015, implying the spread between investment in Ireland and Switzerland of €8.626 in 2010 and €13.923 in 2015.
Obviously, the earlier analysis is sensitive to the time frame for investment chosen (Chart 4).
Chart 4:
 Suppose a bet €1.00 was made on Ireland Inc based on its external economic performance back in 1995. An investor betting on our external balance would have grossed 0.393 cents on every euro invested by today and can be expected to gross a loss of 1 cent by 2015. An identical bet on Luxembourg would have netted a gross return of 11.23 cents by now, and a projected gain of 13.305 cents by 2015. The differences are slightly less dramatic when we look at comparison to Switzerland: a bet of €1.00 on Swiss external balance made in 1995 would have netted investor 9.54 cents by 2010 and is expected to yield 11.88 cents by 2015. Oh, and there wouldn't be any risk of getting these returns expropriated by the Government tax policy changes.
(Second post to follow)
In the light of the ongoing sovereign crisis, and with all the talk about bond markets unwillingness to underwrite our economy, I decided to return to the same issue. Here are major comparatives in investment (bonds-related) fundamentals in Ireland vis-a-vis Switzerland and Luxembourg.
I do this in a series of 4 posts. The first one deals with current account dynamics, the second one will deal with Government finances, the third one will show comparatives for GDP, and the fourth one will conclude by making comparisons across other variables, such as inflation, population growth and labour markets.
All data is based on IMF's World Economic Outlook, updates for April and July 2010, which covers period from 1980-2015. Some additional forecasts (beyond 2015) were performed by myself, alongside some additional variables computations.
I chose the two countries for several reasons:
- Both are core European countries;
- One of these is outside the EU, another is inside the same tent as Ireland;
- With a caveat concerning some of aggregate accounting issues with Luxembourg's data, all three have roughly similar economies characterized by: (a) no significant natural resources of their own, (b) small size of population and land mass, (c) heavy reliance on exports, (d) open nature of economies, (e) 'more Boston than Berlin' aspirations in tax policies, (f) being a bit of a thorn in the softer side of Brussels, and so on
Chart 1:
 If our expected current account surplus of 2010 were to be used to pay down our debt, how long would it take? The answer to it is 'forever'. Our net surplus from trade and investments from the entire world was negative €4.03bn throughout the 2000s. In the 1990s, our average current account surplus was just €1.108bn, in 2010 our expected surplus in the only year when current account was positive in the 200s - the year 2010 - will be only €849mln. At the same time, our debt currently stands at €86.83bn and rising with interest bill on this well in excess of €4.56bn annually at latest 10 year bond auction yields. In other words, exporting our way out of the recession will not even cover our entire interest bill.
Here's an interesting observation. Irish Government thinks that exports will carry Ireland out of the recession. However, there is an argument to be made that value added in our exports is not really that impressive once the inputs costs are taken out.
Chart 2:
 If you were an investor thinking about Ireland's fundamentals, you wouldn't have much hope of getting a positive return on your investment, if net exports were your underlying security, except in the period 1992-2000.
This, one can argue, might be true of our manufacturing exports, where we import often expensive inputs and where transfer pricing (on inter-company sales) further contributes to lower net value added. But what about our services trade? Well, the current account data shows that during the last decade, when services trade really started to take off in Ireland, our net external balance was negative. So something is not adding up and I will take a look at this in the forthcoming posts.
But for now, we do have impressive exporters, yet our current account performance has been exceptionally weak, compared to Switzerland and Luxembourg - two countries that are equally as reliant on imported inputs as Ireland.
It is worth noting also that in the case of Switzerland, their exports composition includes significant pharma and high tech manufacturing exports as well. It just appears that they manage to do trade better...
In fact, a bet made on Ireland Inc based on its external economic performance back in 1980 would have been a disastrous one as Chart 3 below illustrates. An investor betting on our external balance would have 48.1 cents on every euro invested. Based on IMF forecasts, by 2015 this loss can be expected to widen to 48.9 cents. At the same time, identical bet on Luxembourg would have netted a gross return of over €5.11 by now, and a projected gain of €9.20 by 2015: a spread in return relative to Ireland of €5.59 by 2010 and €9.69 by 2015.
Chart 3:
 The differences are even more dramatic when we look at comparison to Switzerland: a bet of €1.00 on Swiss external balance made in 1980 would have netted investor €8.145 by 2010 and is expected to yield €13.434 by 2015, implying the spread between investment in Ireland and Switzerland of €8.626 in 2010 and €13.923 in 2015.
Obviously, the earlier analysis is sensitive to the time frame for investment chosen (Chart 4).
 Suppose a bet €1.00 was made on Ireland Inc based on its external economic performance back in 1995. An investor betting on our external balance would have grossed 0.393 cents on every euro invested by today and can be expected to gross a loss of 1 cent by 2015. An identical bet on Luxembourg would have netted a gross return of 11.23 cents by now, and a projected gain of 13.305 cents by 2015. The differences are slightly less dramatic when we look at comparison to Switzerland: a bet of €1.00 on Swiss external balance made in 1995 would have netted investor 9.54 cents by 2010 and is expected to yield 11.88 cents by 2015. Oh, and there wouldn't be any risk of getting these returns expropriated by the Government tax policy changes.
(Second post to follow)
Friday, August 20, 2010
Economics 20/8/10: BOSI lessons
Some impressive numbers from BOSI withdrawal from the Irish market are:
- BOSI holds a €32bn loan book in the Irish market (total Irish market is ca €350bn)
- BOSI holds a just over 9% market share of total Irish loans market
- BOSI withdrawal of working capital facilities in Ireland will have immediate impact on 12,000 business customers
- BOSI also holds €10bn mortgage book, or 7% of all Irish mortgages
- BOSI holds 5,000 current accounts
- Amazingly, 44% of the bank’s book was impaired as per H1 2010 generating a write-off of €4bn in loans
- Per Bloxham stockbrokers: "the move is likely to have a negative impact in the economy where liquidity is still scarce and the closing off of business lines will force some businesses to wall" (sic).
Thursday, August 19, 2010
Economics 19/8/10: Irish bonds & our fndamentals
This is an unedited version of my article in the Irish Examiner from August 18, 2010.
The latest Irish bonds auction was perhaps the most eagerly anticipated event in the NTMA’s history. Its outcome was a small victory for NTMA, but a Pyrrhic victory for Ireland.
A quick guide to the results first. Facing svere headwinds from the markets, NTMA managed to sell 4 and 10 year bonds at average yields of 3.627% and 5.386% respectively.
This means that NTMA improved on July auction of 10 year bonds, but is still locked into what amounts to the third highest cost of borrowing over the last three years. A year ago the same bonds were placed at an average yield of 4.55% - which means that borrowing €1 billion today is now €8.4 million costlier than a year ago.
However, the NTMA results are hardly a reason to cheer, from the economy wide perspective.
Three events have triggered the extraordinary global attention to Irish bonds over the last few weeks. Firstly, there was a public relations flop when the ECB had to step in provide support for Irish bonds by directly buying the surplus paper out of the market. Second by Monday this week, Irish bond spreads over the benchmark German bunds rose to a stratospheric 300 basis points. At the same time, our CDS spreads hovering above 310 basis points benchmarks, were
signaling that markets anticipated a significant probability of Irish Government default on its sovereign debt.
All of these developments, especially set against much calmer changes in yields and CDS spreads in other Eurozone economies have indicated that the markets are changing not just in terms of the overall willingness of bond investors to underwrite risk in general, but in their attitudes to Irish debt in particular.
You see, during the first quarter of this year, sovereign debt crisis has engulfed the peripheral economies of Europe, collectively know as PIIGS (Portugal, Greece, Ireland, Italy and Spain). The crisis, of course, was triggered by the markets belated realisation that these countries economies cannot sustain massive debt and deficit financing liabilities they have taken on before and during the current Great Recession. That was the moment when Ireland was lumped together with the rest of the Eurozone’s sickest economies.
This time around, we are on our own. Over recent months, all of the PIIGS countries have unveiled a series of aggressive deficit reduction and austerity programmes aimed at significantly reducing their future borrowing requirements. All, that is, except for Ireland. Instead, Irish Government has spent the last 9 months waiting for the Trade Unions to vote on the Croke Park deal that actually limited our future ability to address deficits. On top of that, we staunchly resisted markets, the IMF and the EU Commission repeated calls for clarity on specific budgetary measures planned for the period of 2011-2014. Currently, the IMF forecasts Irish deficit to remain at over 5% of GDP in 2015.
In May 2010, before factoring in the latest funding allocations to banks, IMF Fiscal Monitor provided an estimate for Ireland’s borrowing requirements for 2010. These figures are strikingly different from the deficit numbers presented by our official framework. IMF forecast that Ireland will need to borrow at least 19.9% of its GDP in order to finance debt roll overs from previous years maturing in 2010, plus the deficit of -12.2% of GDP. In approximate terms, Ireland’s Government borrowing this year would amount to roughly €33bn before Anglo Irish Bank and INBS latest projections for new funding.
Thus, in the last two weeks, the bond markets have finally began to re-price Irish sovereign debt as if the country is no longer the leader in the PIIGS pack in terms of expected future deficit
corrections.
In the end, the markets are right. Ireland is facing a massive debt and deficit overhang that is well in excess of any other advanced economy in the world. And contrary to official statements uttered on the matter this week, this twin problem is not a matter of one-off recapitalization of the Anglo Irish Bank. Instead, it is a long-term structural one.
Take first the banks. The recapitalization and balance sheets repair approach undertaken by the Government so far means that Nama alone can be expected to lose around €12 billion over the next 10 years. These losses will have to be underwritten by the Irish economy.
In addition, total losses by the Irish banks are likely to add up to between €49 and €53 billion over the next three-four years. These can be broken down to €33-36 billion that will be needed in the end for the zombie Anglo, €6bn for equally gravely sick INBS, at least €8 billion for AIB and up to €2 billion for the healthiest of all – Bank of Ireland.
These numbers are based on my own analysis and are confirmed by slightly more pessimistic estimates by the independent banking sector analyst Peter Mathews. Once again, Irish economy – or in other words all of us – can be expected to underwrite these. Thus, total bill for ‘repairing’ Irish banks via Government preferred approach of Nama, plus recapitalizations is likely to be €61-65 billion over the next decade.
Now, consider our current spending. Having slashed capital expenditure down to the bone, the Government has committed itself to preserving public sector pay and employment through 2014. Transfers – including welfare and subsidies – are pretty much a no-go area for serious
savings, given continued rises in unemployment, long term nature of new joblessness and political dynamics in the country. Between them, these two spending headlines account for over 1/3 of the entire deterioration in our public spending from 2008 to-date.
Budget 2010 forecasted that our debt to GDP ratio will peak at around 84% in 2012 and will slowly decline thereafter. This, of course, is clearly an underestimate, but even by that metric, we are looking at a debt mountain of over €152 billion.
All of this means that at the very least, Irish state debt will be well in excess of €210 billion by 2014-2015. Given yesterday’s auction results, the interest bill on this debt alone will total €11.3 billion annually – more than 1/3 of all tax revenue collected in 2009.
Let’s put this into more easily understood perspective. If Ireland were a household and its debt constituted its mortgage taken over 30 years, the ‘family’ will be spending more than half of its total gross income on interest and principal repayments.
Or put differently, the legacy of this crisis and systemically mistaken approach taken to repairing the banking sector will amount to over €111,000 in new debt dumped on the shoulders of every currently employed person in the country. To say, as our policymakers and official analysts do, that this figure doesn’t really matter because it is a ‘one-off measure’ is adding insult to the injury.
Tuesday, August 17, 2010
Economics 18/8/10: NTMA's foray into bond markets wilderness
As promised - a more in-depth analysis of today's data from NTMA auction.
"The Gruffalo said that no gruffalo should
Ever set foot
In the deep dark wood"
Clearly, bent on saving nation's face, the NTMA could not pass on going to the markets today.
First, let us take a look at the changes in averages from April 2009 first auction through today, against the same averages for the period excluding today's auction.
 So today’s auctions have led to:
Even more interesting stats are in the price and yield spreads:
 Again, for across all issues averages spreads in prices rose significantly – by 8.3% and spreads in yields rose 7.85%. This is on the back of 10 year paper alone, suggesting the following two things:
Some charts illustrate more general trends.
Short term paper auctions first (5 years and less):
 Average yield is still on the rising trend despite a clearly 'extraordinary' move down in today's auction. Even steeper upward trend for November 2009-present is still present. Yield spreads are on the upward move again once more signaling potential rise in overall market skepticism.
 Price spread trends up predictably in line with yield spread trend. To see it in absolute terms:
 Weighted average price achieved in the auctions:
 Again, if ECB speculations play out to be true, the small uptick in price in last auction can be written off completely.
Now to longer maturity (10 years and above).
 Average yield down, but still above long term trend. Yield spreads up, quite significantly. As I mentioned in the earlier post, latest auction produced yield spreads of 9.9bps - third highest spread since April 2009.
 Price spreads are 75bps - second highest spread since April 2009. Cover down - lowest since February 2009 and is down year on year. Again, to highlight spreads in real terms:
 Next, look at the price achieved:
 This hardly constitutes any sort of 'success'. May be, just may be - some sort of a stabilization, with mean reversion still incomplete.
Now to the maturity profile of our debt:
 We keep on loading the 2014 end of the spectrum - bang on for the year when we are supposed to reach 3% deficit. Of course, with already close to €5 billion in rollovers due in 2014, it's hard to imagine how this is going to help our fiscal position.
"The Gruffalo said that no gruffalo should
Ever set foot
In the deep dark wood"
Clearly, bent on saving nation's face, the NTMA could not pass on going to the markets today.
First, let us take a look at the changes in averages from April 2009 first auction through today, against the same averages for the period excluding today's auction.
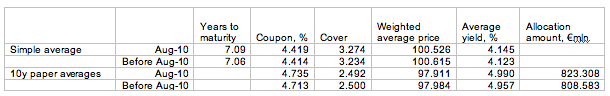 So today’s auctions have led to:
- a small increase in overall maturity profile of Irish debt (good news)
- a small increase in average coupon paid for all maturities (true future liabilities on debt)
- a modest rise in average cover (potentially due to massive overbidding by ECB, but this is a speculative remark at this moment in time)
- a drop in average price paid and a corresponding rise in the weighted average yield.
- Average coupon rose by ca ½ basis point;
- Average cover dropped
- Weighted average price declined and weighted average yield rose (the latter by almost 0.7%)
- Average allocation amount rose.
Even more interesting stats are in the price and yield spreads:
 Again, for across all issues averages spreads in prices rose significantly – by 8.3% and spreads in yields rose 7.85%. This is on the back of 10 year paper alone, suggesting the following two things:
- Whatever was happening in the shorter term paper market (cover and lower yields) appears to be disconnected from what was going on in longer term paper markets (perhaps the rumoured ECB intervention on the shorter side was after all true?);
- Since the prices and yields reflect bids by market makers – the widening of the spreads between max and min bids might be indicative of the markets inability to tightly price Irish sovereign risk. In other words, this might signal general markets uneasiness about the bonds.
Some charts illustrate more general trends.
Short term paper auctions first (5 years and less):
 Average yield is still on the rising trend despite a clearly 'extraordinary' move down in today's auction. Even steeper upward trend for November 2009-present is still present. Yield spreads are on the upward move again once more signaling potential rise in overall market skepticism.
 Price spread trends up predictably in line with yield spread trend. To see it in absolute terms:
 Weighted average price achieved in the auctions:
 Again, if ECB speculations play out to be true, the small uptick in price in last auction can be written off completely.
Now to longer maturity (10 years and above).
 Average yield down, but still above long term trend. Yield spreads up, quite significantly. As I mentioned in the earlier post, latest auction produced yield spreads of 9.9bps - third highest spread since April 2009.
 Price spreads are 75bps - second highest spread since April 2009. Cover down - lowest since February 2009 and is down year on year. Again, to highlight spreads in real terms:
 Next, look at the price achieved:
 This hardly constitutes any sort of 'success'. May be, just may be - some sort of a stabilization, with mean reversion still incomplete.
Now to the maturity profile of our debt:
 We keep on loading the 2014 end of the spectrum - bang on for the year when we are supposed to reach 3% deficit. Of course, with already close to €5 billion in rollovers due in 2014, it's hard to imagine how this is going to help our fiscal position.
Subscribe to:
Posts (Atom)
